Ever wonder if a futures contract could protect your investments while steering you through market shifts? Bond futures can act as a financial safety net, offering hints about where interest rates are headed and which way the market might move.
Today, we’re diving into how these contracts help smooth out the wild swings in government bonds. They also become handy tools for traders who need quick market clues.
Stick with us as we unpack why bond futures have turned into must-have instruments for managing market risk.
Understanding Bond Futures Fundamentals
Bond futures are standard contracts traded on the CME that let you buy or sell US government bonds at a set future date. They act as a kind of protection against changes in interest rates. In simple terms, these contracts promise the delivery of certain securities, like US Treasuries, following a regulated process. For example, the US 30-Year T-Bond Futures (symbol USU25) expires on September 25, highlighting how these tools not only manage risk but also add market insight and liquidity.
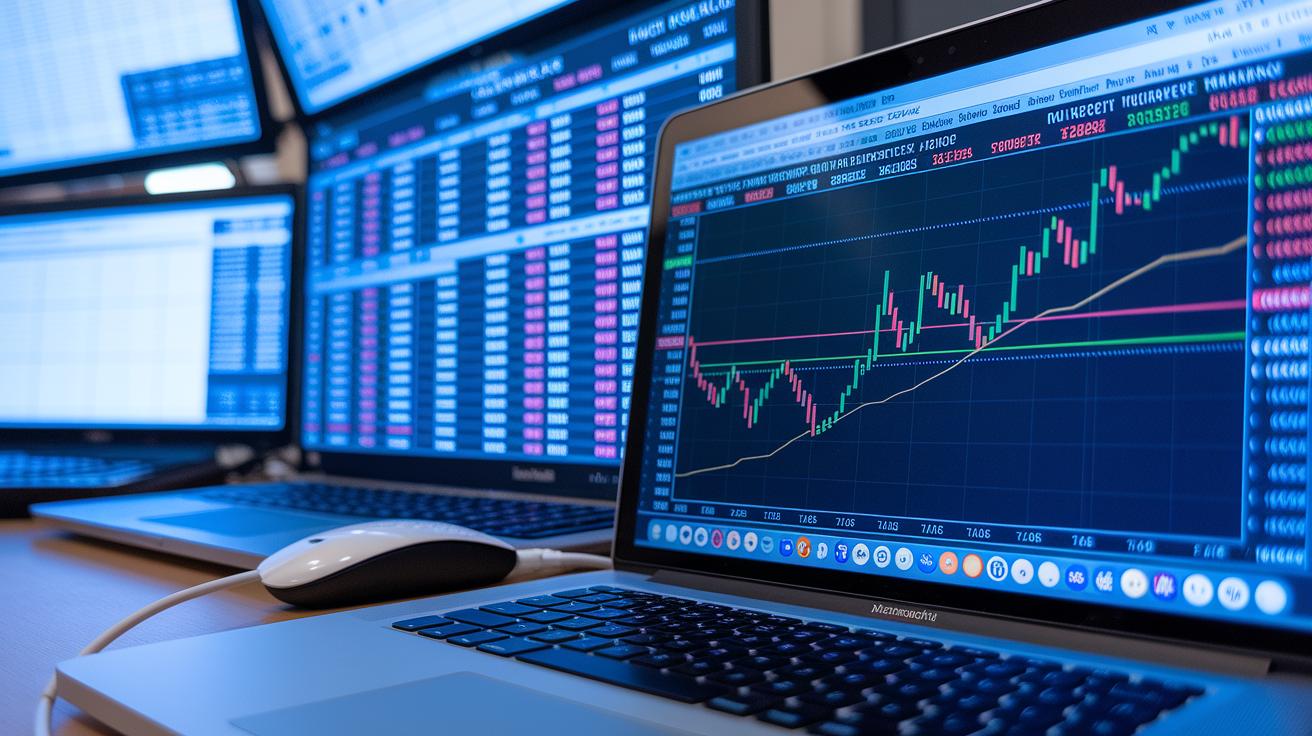
When investors fear rising rates, they often turn to bond futures as a form of insurance for their portfolios. Trading platforms offer real-time technical charts and pivot calculators to help them analyze the market quickly. By studying these price movements, traders can spot trends and find the right moment to act, even when risks are on the horizon.
Bond futures also play a big role in the overall market, working alongside other instruments such as government securities futures and treasury bond contracts. Picture a market strategist sharing, "Before I joined finance, I never realized how yield changes could sneak up and shift a portfolio's balance." This insight shows why it’s so important to understand bond futures when managing the ups and downs of US government bonds. For more on market instruments, check out stock market futures.
Trading Mechanics of Treasury Bond Contracts
Treasury bond contracts are carefully designed instruments traded on established exchanges to help manage exposure to US government bonds. They come with clear, standard guidelines that make them accessible whether you're a seasoned trader or just starting out. For example, the 30-Year contract carries a $100,000 par value and its smallest price move is set at 1/32, which works out to roughly $31.25. Even the tiniest fluctuation can really add up, affecting your profit or loss.
Behind the scenes, these contracts operate with precision. They feature specific delivery months and enforce strict rules on the funds you must keep in your account, known as margin requirements, to cover potential losses. A key part of the process is choosing the cheapest-to-deliver US government bond, a decision that can significantly influence the contract’s performance as it nears expiration. In short, these built-in safeguards ensure that traders can navigate market shifts with a degree of confidence.
| Contract | Underlying | Contract Size | Tick Value | Expiry Months |
|---|---|---|---|---|
| 2-Year | US Treasury | $100,000 | Calculated per tick | Variable |
| 5-Year | US Treasury | $100,000 | Calculated per tick | Variable |
| 10-Year | US Treasury | $100,000 | Calculated per tick | Variable |
| 30-Year | US Treasury | $100,000 | 1/32 (≈$31.25) | Variable |
Bond Futures: Thrilling Market Insights
Bond futures pricing boils down to turning tricky market signals into clear, actionable ideas. The core pricing method is simple. You start with the bond price and adjust it by dividing by the conversion factor, then subtract the interest that has built up since the last coupon payment. This adjustment makes it easier to compare futures quotes with quotes from the actual cash market.
At the heart of things lies the basis. This is simply the difference between the yield on cash bonds and the yield suggested by the futures price. Imagine you are watching a live bond chart and notice the gap between cash and futures yields getting smaller. This narrowing gap can hint that market conditions might change soon, possibly leading to lower price swings than expected.
Traders often use real-time treasury yield charts, especially for instruments like 10-Year yield futures, to watch for these shifts. By looking closely at the 10-Year data, they can tell if a market is being overbought or oversold. Tools like pivot calculators then take raw numbers and break them down step by step, turning data into clear trading signals.
In practical terms, yield curve trading means comparing different parts of the curve to gauge where interest rates might head. When the futures yield consistently falls below the cash yield, it can be a sign that rates may drop. On the other hand, if the gap widens, it might mean rates are expected to rise.
All of these techniques give market players the power to see hidden details in bond trends. When real-time data meets a solid pricing model, charts become more than just numbers. They turn into useful guides that deliver exciting insights into how the market is moving.
Bond Futures vs Other Fixed Income Derivatives
Bond futures offer a clear advantage within fixed income derivatives. They stand out against swaps and government bond options thanks to their easy-to-understand pricing and set trading rules. This makes them a smart choice for managing interest rate risks without dealing with the often complicated settlement rules that come with swaps. For example, options can bring extra premiums and variable strike prices, while bond futures use standard contract sizes and fixed tick values, keeping the risk profile simple and measurable.
US T-Bond futures, in particular, shine with deep liquidity and lower trading costs compared to European Bund and UK GILT futures. In practice, this means that when you trade US government bonds, you get tighter bid-ask spreads and a smoother execution process. In contrast, international treasuries can bring extra uncertainty due to different settlement methods and less liquid markets.
Looking at yield differences, bond futures let you factor in both the underlying bond yield and the cost of carry. On the other hand, swaps and options might show higher volatility and wider yield ranges because of their flexible structure. Many traders agree that US T-Bond futures offer a rare blend of predictability and cost efficiency that other fixed income tools often fall short of.
Thinking about these differences can guide you in picking the right tool, whether you are looking to hedge your risks or speculate based on market trends.
Strategies and Risk Management for Bond Futures Trading
When you dive into bond futures trading, blending smart strategies with tight risk management can really help fortify your portfolio. Start by looking into yield-curve spread trades, for example, tracking the shifts between 2-Year and 10-Year futures. Imagine noticing that the yield gap unexpectedly widens; that could be your cue for a tactical spread trade that leverages the movement between short-term and long-term rates.
Another hands-on method is basis trading, where you keep a close watch on the gap between the cash price and the futures price. Picture it like this: as the gap narrows, it might be time to adjust your plan, either by scaling into your position or getting ready for a market correction. Similarly, trading strategies that hinge on curve-steepening or curve-flattening scenarios let you benefit from subtle shifts in the market. For instance, if the yield curve begins to flatten, that could signal a lower reaction to rate changes across different periods, suggesting it’s time to tweak your positions.
Risk management is truly the backbone of any futures trading strategy. Tools like DV01, a simple way to see the price change for a one-point shift in yield, and convexity metrics give you a clear picture of how sensitive your position is to tiny interest rate moves. Plus, margin calculators work alongside these tools to ensure you have enough collateral to handle sudden shocks in the market. This balance is key when you’re figuring out the right size for your futures positions, as it helps you weigh potential gains against the risks.
And don’t forget: keeping track of position limit rules set by exchanges is vital. These limits are designed to avoid over-concentration in your trades, which could leave you exposed during wild market swings. By mixing these strategic moves with disciplined risk management, you’re setting yourself up for a balanced and informed approach to trading bond futures, even when the market gets a bit turbulent.
Historical Performance and Market Impact of 10-Year Yield Futures
Over the last five years, watching the 10-year yield futures has given us a pretty clear view of how investors feel and behave. When the Fed tightened its policies, especially in 2018 and 2022, these contracts saw sharp volatility. It was like a sudden rush on the trading floor, often happening when shorter-term instruments, such as 2-year bonds, began to show signs of strain. This pattern pointed to a growing difference between what investors expect for near-term rates and the steadier outlook for longer-dated securities.
Another key point is the impact of yield curve inversions. Normally, longer-term bonds offer higher yields than shorter-term ones. But occasionally, the 2-year yield goes above the 10-year yield, and this flip tends to bring on more trading and wider price swings. Market players react quickly, adjusting their positions amid the confusion. Studies have also shown that these shifts in the yield curve match up with other big economic changes like shifts in employment and production. In short, when you see these movements, it’s often a sign that the economic outlook might be shifting, prompting traders to rethink their risk.
Final Words
In the action, our blog post unraveled bond futures fundamentals, from their role in hedging interest-rate risk to detailed trading mechanics and price analysis. We compared these instruments against other fixed-income derivatives, spotlighting treasury bond contracts’ specifics and risk-management techniques. Historical data on 10-year yield futures added valuable context, showing how market trends shape investment strategies. All these insights reinforce the potential of bond futures in spurring smart investment decisions and staying ahead of market trends. Keep moving forward with a clear perspective on the evolving financial market.
FAQ
Frequently Asked Questions
What do 10-year bond futures and their live data represent?
The term “10-year bond futures” defines standardized contracts based on U.S. Treasuries, where live data offers real-time insight into market conditions for hedging and speculative strategies.
How is a bond futures price determined and shown on charts?
Bond futures prices are derived by adjusting the underlying bond price using conversion factors and accrued interest, with charts displaying these prices alongside technical trends for informed decision-making.
What are 20-year bond futures used for?
“20-year bond futures” refer to contracts based on 20-year government bonds that help traders manage interest rate exposure and monitor long-term yield trends in financial markets.
How are 30-year bond futures charts useful?
“30-year bond futures charts” visualize price movements and trading activity for extended maturity contracts, offering traders a clear view of long-term market trends and yield dynamics.
What are U.S. Treasury bond futures and why trade them?
U.S. Treasury bond futures are exchange-traded contracts backed by government securities, enabling traders to hedge interest rate risks and gauge market sentiment on U.S. economic policy.
What is the forecast for U.S. bonds?
The U.S. bond forecast stems from analyzing yield curves, economic indicators, and policy signals, offering projections on future interest rate movements and market performance.
What is the meaning of bond futures?
Bond futures are contracts that obligate the exchange of government bonds at a future date and set price, providing a tool for managing interest rate risk and market exposure.
How is the U.S. bond market performing?
The U.S. bond market performance is gauged by examining yield trends, trading volumes, and economic metrics, which reflect investor sentiment and prevailing interest rate conditions.
What are current T-bills yields?
T-bills yields indicate short-term interest rates on Treasury bills, updated regularly to mirror recent economic data and supply-demand dynamics in the money markets.